Since the pandemic, food delivery apps have significantly changed how people order and enjoy their favorite meals. Quick Service Restaurants like Domino’s Pizza have also accelerated their digital transformation, seeing a substantial rise in app customers and orders. Domino’s now has 7.9 million active users placing their pizza orders through the mobile app. Similarly, Chick-fil-A has successfully built stronger relationships with its customers through its app.
Our comprehensive report on North America-based food delivery companies highlights 75 leading brands. Here, we focus on comparing 27 QSRs, including Jersey Mike’s Subs, Panda Express, Chick-fil-A, Checkers, Dave’s Hot Chicken, Blaze Pizza, Raising Cane’s Chicken Fingers, Burger King, Popeyes, 7NOW, IHOP, Casey’s, McDonald’s, Arby’s, Whataburger, Firehouse Subs, Chipotle, KFC, Subway, CAVA, Wendy’s, Zaxby’s, Taco Bell, Panera Bread, Buffalo Wild Wings, Jack in the Box, and Dairy Queen. We assess these brands using sentiment rates—both positive and negative—from app reviews across three key areas: app usability, service quality, and product quality. This analysis offers a comprehensive view of how these QSRs are perceived by their customers.
Additionally, this blog post compares the sentiment rates of QSR companies with those of several leading food delivery apps featured in our report, including Grubhub, Uber Eats, DoorDash, Favor, Toast, and Takeout. We examine how these companies fare in terms of customer sentiment across these critical dimensions.
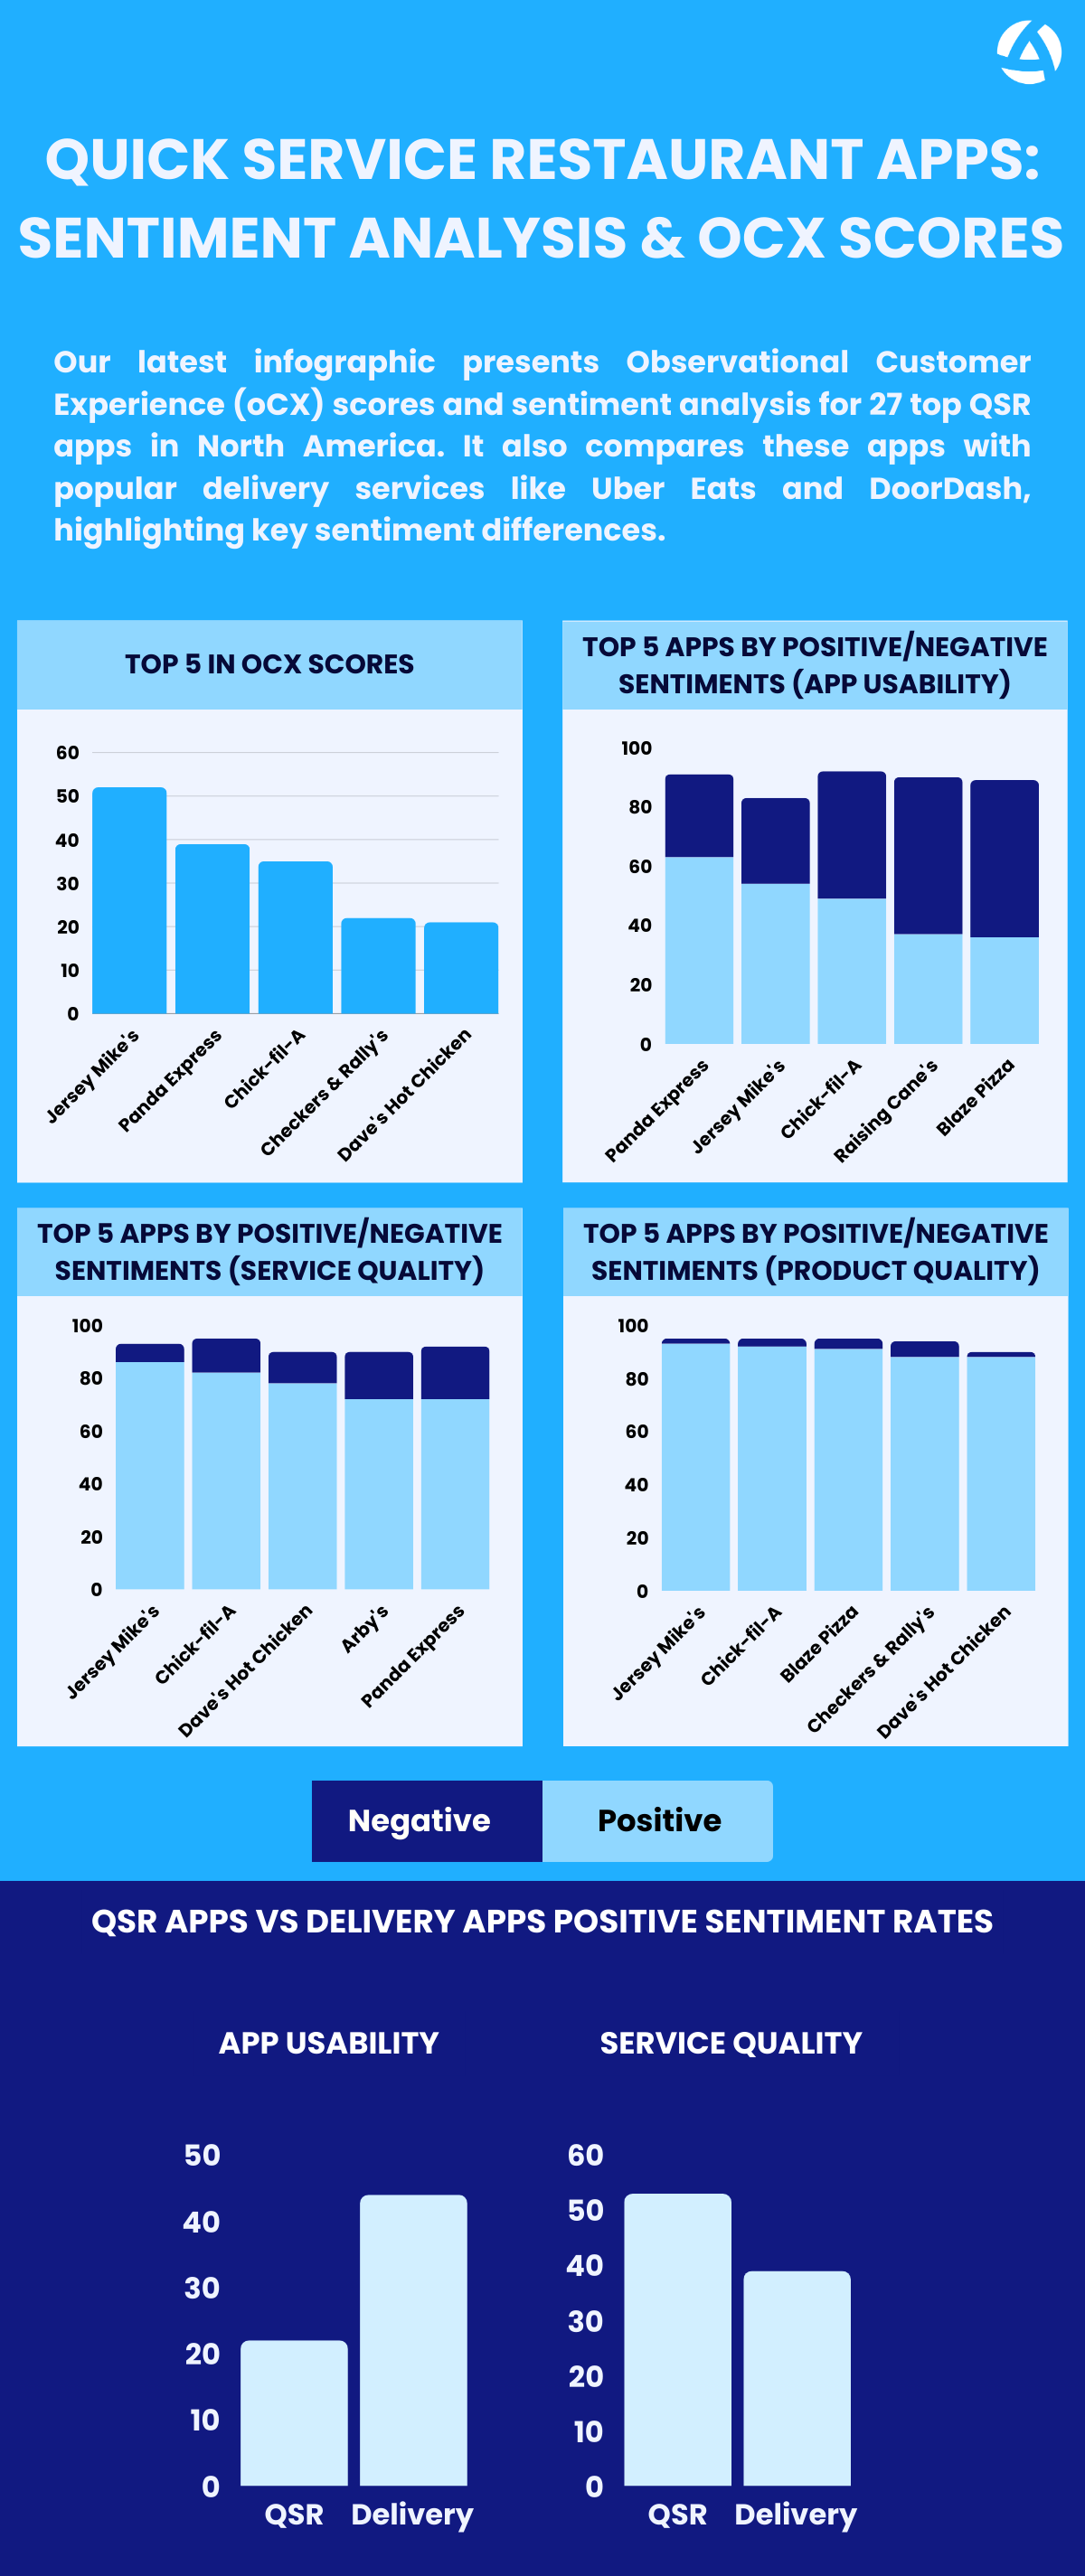
General oCX Scores and Rankings
When looking at the general oCX scores and rankings, we see a diverse range of performances. Jersey Mike’s Subs, with a general oCX score of 27 and ranking 10th, showcases a strong overall performance. Chick-fil-A and Blaze Pizza also rank relatively well, with general oCX scores of 21 and 17, placing them at 14th and 26th, respectively. In contrast, Buffalo Wild Wings, Jack in the Box, and Panera Bread rank near the bottom, with general oCX scores of -74, -86, and -76, underscoring significant areas for improvement. Notably, out of the 27 QSRs, only three have an oCX score above zero, indicating that many QSRs have substantial room for improvement.
Sentiment Analysis for App Usability
App usability is crucial for QSRs that rely heavily on mobile orders. According to our data, app usability scores vary significantly among the QSRs. The sentiment analysis underscores these findings. Buffalo Wild Wings has the lowest positive sentiment rate at 4% and the highest negative sentiment rate at 89%. Similarly, Jack in the Box and Taco Bell show low positive sentiment rates of 2% and 6%, respectively, with high negative sentiments. In contrast, Panda Express stands out with a 63% positive sentiment and only a 28% negative sentiment. Jersey Mike’s Subs and Chick-fil-A also have higher positive sentiment rates of 54% and 49%, respectively, with relatively lower negative sentiments.
Common Themes in Negative Reviews for App Usability
Negative reviews for app usability highlight several recurring themes. Technical issues, such as frequent crashes and slow loading times, are common complaints. Users also report difficulties with the user interface and navigation, citing complicated and non-intuitive layouts. Ordering process issues, including problems with placing orders and errors in payment processing, frustrate customers further. Additionally, account and login issues, such as trouble creating accounts or staying logged in, are prevalent. Location and delivery problems, like incorrect address detection and tracking errors, are frequent. Lastly, poor customer support and communication exacerbate these issues, leaving users dissatisfied with their overall experience.
Sentiment Analysis for Service Quality
Service quality is another key aspect of customer satisfaction. The data paints a diverse picture in this area. Jersey Mike’s Subs leads with an 86% positive sentiment rate and only a 7% negative sentiment, indicating high customer satisfaction. Chick-fil-A and Dave’s Hot Chicken also perform well, with positive sentiment rates of 82% and 78%, respectively. Conversely, Jack in the Box faces challenges with a positive sentiment rate of just 5% and a negative sentiment rate of 85%. Buffalo Wild Wings and Panera Bread also show room for improvement with low positive sentiment rates of 19% and 8%, respectively.
Sentiment Analysis for Product Quality
Product quality is a paramount concern for customers, and the QSRs show varied performances in this area as well. Jersey Mike’s Subs excels with a positive sentiment rate of 93% and a minimal negative sentiment rate of 2%. Chick-fil-A and Blaze Pizza also show strong results, with positive sentiment rates of 92% and 91%, respectively. Jack in the Box again shows room for improvement with a positive sentiment rate of 13% and a negative sentiment rate of 38%. Panera Bread and Buffalo Wild Wings also have lower positive sentiment rates of 38% and 66%, respectively.
Comparing QSR Apps with Delivery Apps
When comparing QSR apps to delivery apps (Uber Eats, DoorDash, Grubhub, Postmates, Favor) based on sentiment analysis, notable differences emerge. Delivery apps have a higher positive sentiment rate of 44%, whereas QSR apps have only 22%. Negative sentiment rates for app usability are also lower for delivery apps at 44%, compared to 67% for QSRs.
In terms of service quality, QSRs outperform delivery apps in positive sentiment rate at 53% versus 39% for delivery apps. However, delivery apps have a higher negative sentiment rate of 53%, compared to 38% for QSRs.
For product quality, both QSRs and delivery apps show similar positive sentiment rates, with QSRs at 83% and delivery apps at 84%. Negative sentiment rates are also comparable, with QSRs at 8% and delivery apps at 7%.
Key Takeaways:
- Top Performers: Panda Express, Jersey Mike’s, and Chick-fil-A stand out with significantly higher positive app usability compared to the other 24 QSR apps. They are the only QSRs in the report where positive sentiment reviews outweigh negative sentiment reviews.
- App Usability Comparison: Delivery companies, on average, receive twice as many positive sentiment reviews for app usability compared to QSRs.
- Service Quality: QSRs, on average, have 1.35 times higher positive sentiment reviews for service quality compared to delivery companies.
- App Usability Issues: Among the biggest problems in app usability, ordering process issues accounted for 33% of the negative reviews.
For more insights, visit our report page and download the full report.